LyveCom Analytics – Help Center GuideUpdated 4 months ago
LyveCom Analytics – Help Center Guide
Audience: New and scaling ecommerce brands looking to turn video into a serious sales channel.
Purpose: A complete walkthrough of the analytics capabilities, how to interpret the data, and how to act on it.
1. Overview
LyveCom provides a built-in analytics suite, designed to give you visibility into how your shoppable video and live-commerce content perform, how shoppers engage with them, and how they convert into revenue.
This guide covers:
What metrics you’ll see
How to navigate the dashboard
How to interpret and act on the data
Best practices & recommended workflows
2. Accessing the Analytics Dashboard
Log into your LyveCom account via Shopify and navigate to the “Analytics” tab
Select the time-range (e.g., last 7 days, custom) for data you’d like to review.
The main dashboard will display high-level metrics and allow drilling into specific content.

3. Key Metrics & What They Mean
Here are the core metrics you’ll encounter, with definitions, why they matter, and how you might act on them:
Metric | Definition | Why It Matters | Actionable Insight |
Overview Tab: | |||
Impressions | The number of times your video content was loaded or displayed. | Gives you a sense of reach and exposure. | If views are low, promote the video more widely, embed it in other pages/channels. |
 | |||
Revenue | The number (or value) of orders that originated from the video experience. Revenue is the total revenue driven. Direct is someone adding an item to cart from a video and checking out immediately. Attributed is an order within 7 days of adding to a cart form a video. | Ultimately, these are the business outcomes you care about: revenue, ROI, lift in average order value, etc. | If conversions are much lower than clicks, look at checkout experience, product-page alignment, or potential friction post-click. |
 | |||
Video Plays | The number of times a viewer played a video on site. | This shows how effective the video is at driving direct shopping behavior.
| If clicks are low relative to views, evaluate placement and visibility of clickable items. |
Video Engagement | The proportion of unique video plays to unique site visitors. | This metric helps you understand the level of interaction and interest your content is generating among viewers.
| If engagement is low (e.g., most viewers drop off early), consider shortening the video, adding stronger hooks in the first few seconds, or revisiting opening content. |
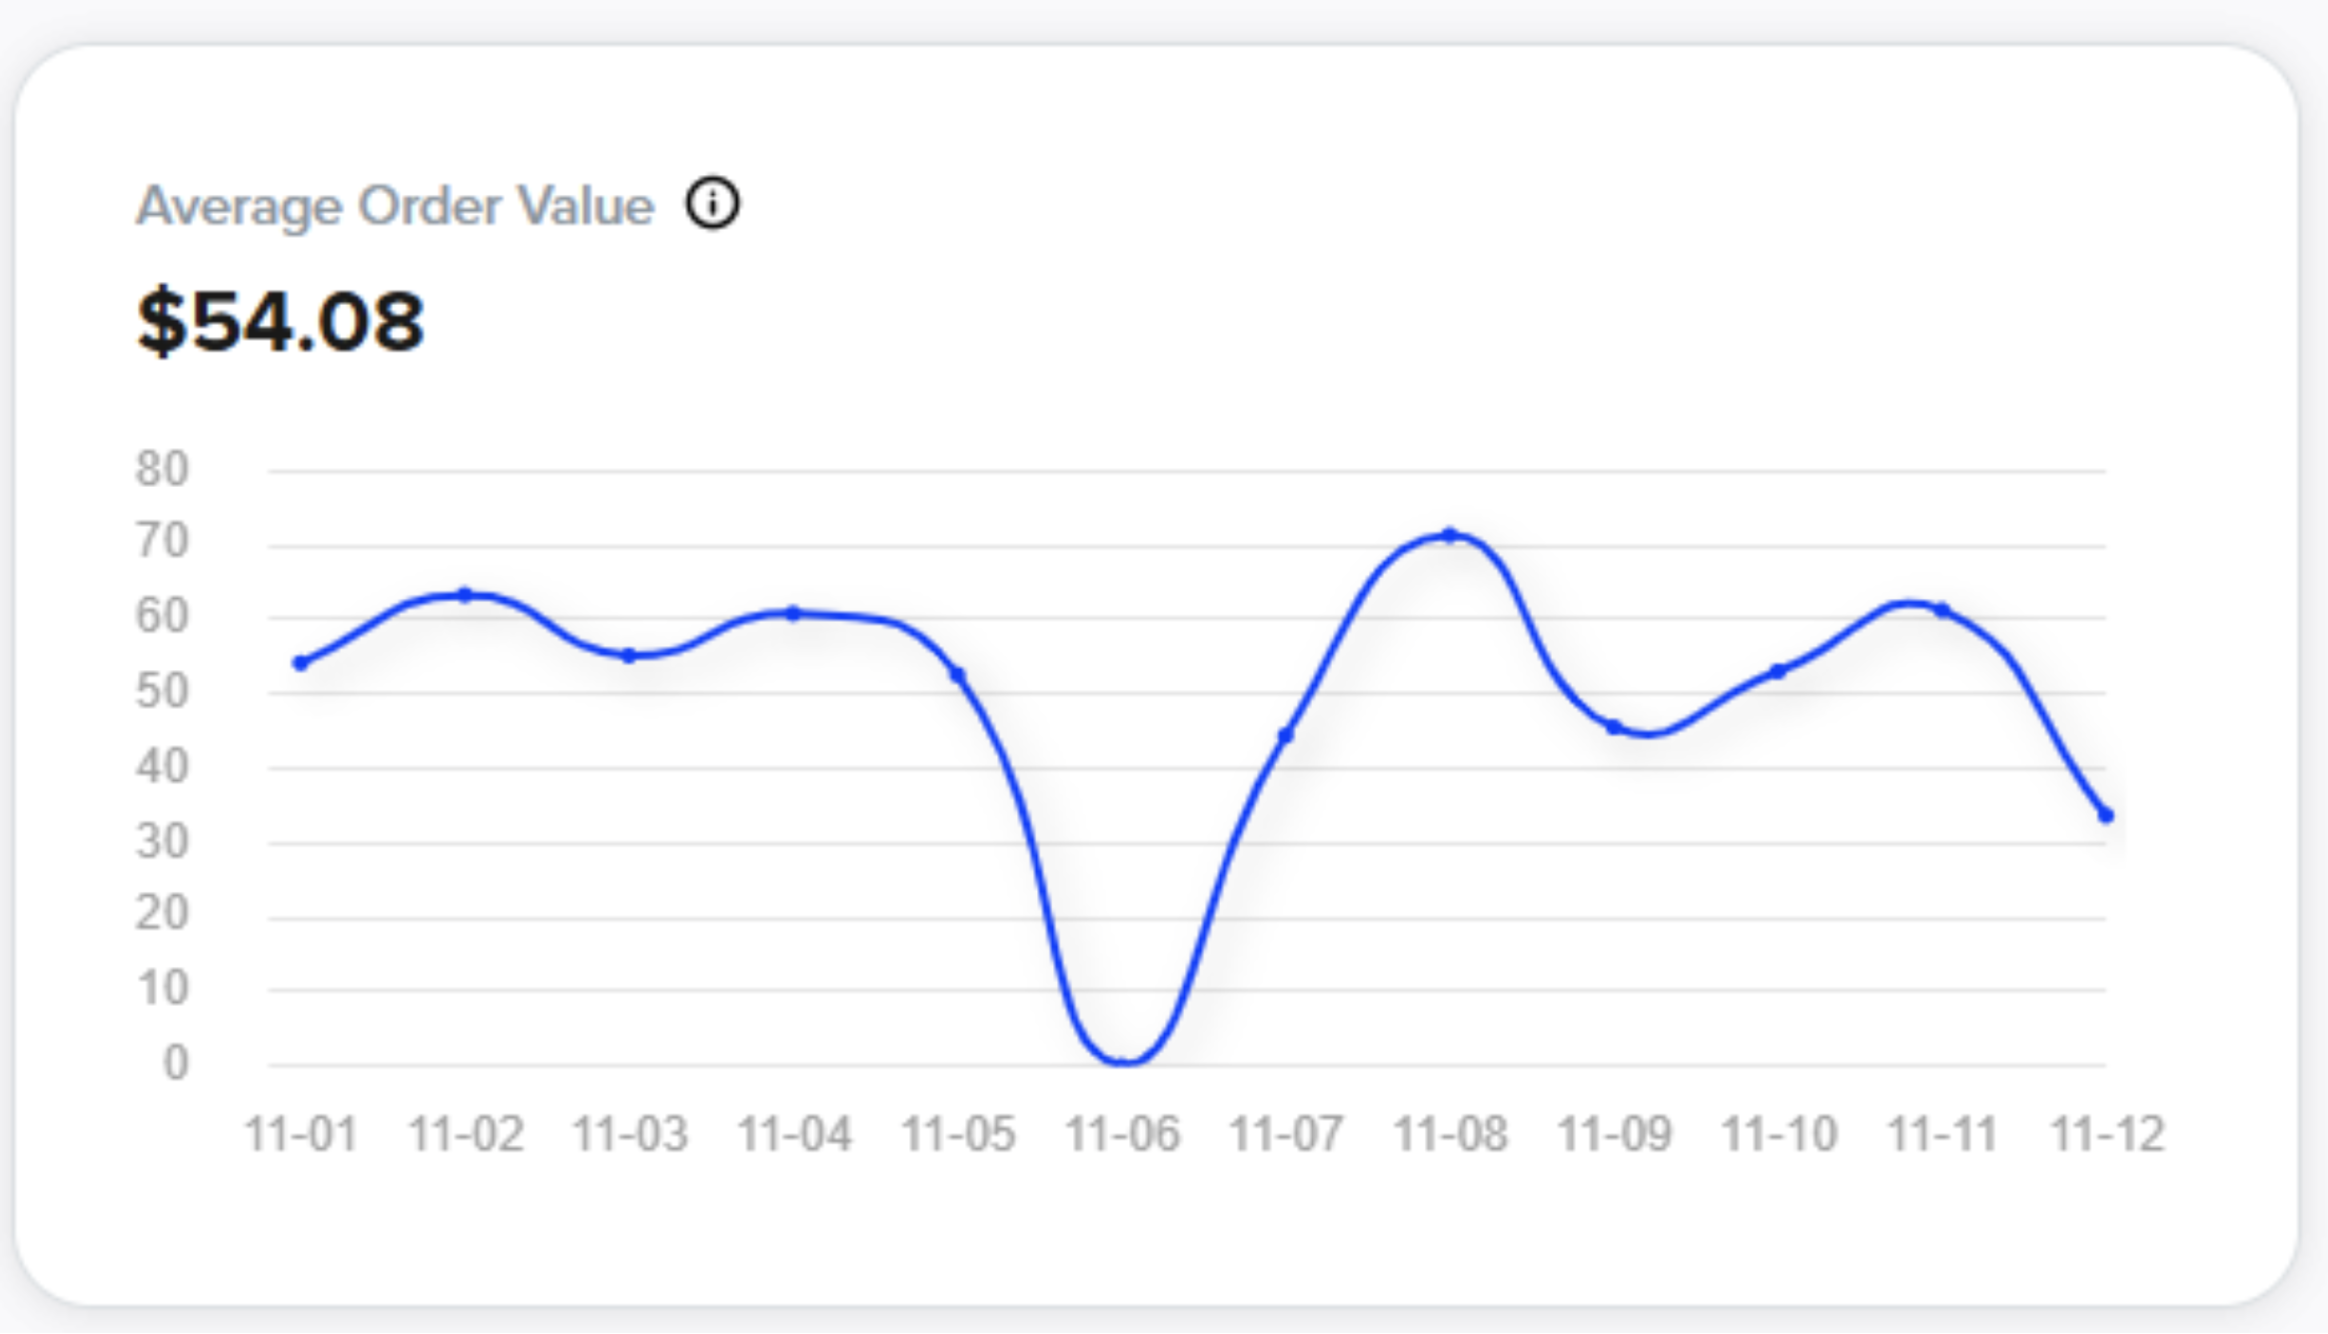
Average Order Value (AOV) for Video-Driven Orders | The average spend on orders that came from video interactions. | Helps you understand the quality of traffic/engagement coming from video. | If AOV is lower than your store average, consider bundling or upsell strategies via video, or feature higher-value items in video. Example: Tagging multiple products that go well together or are frequently bought together. Cross sell by adding a carousel to the PDP page with multiple different products. |
 | |||
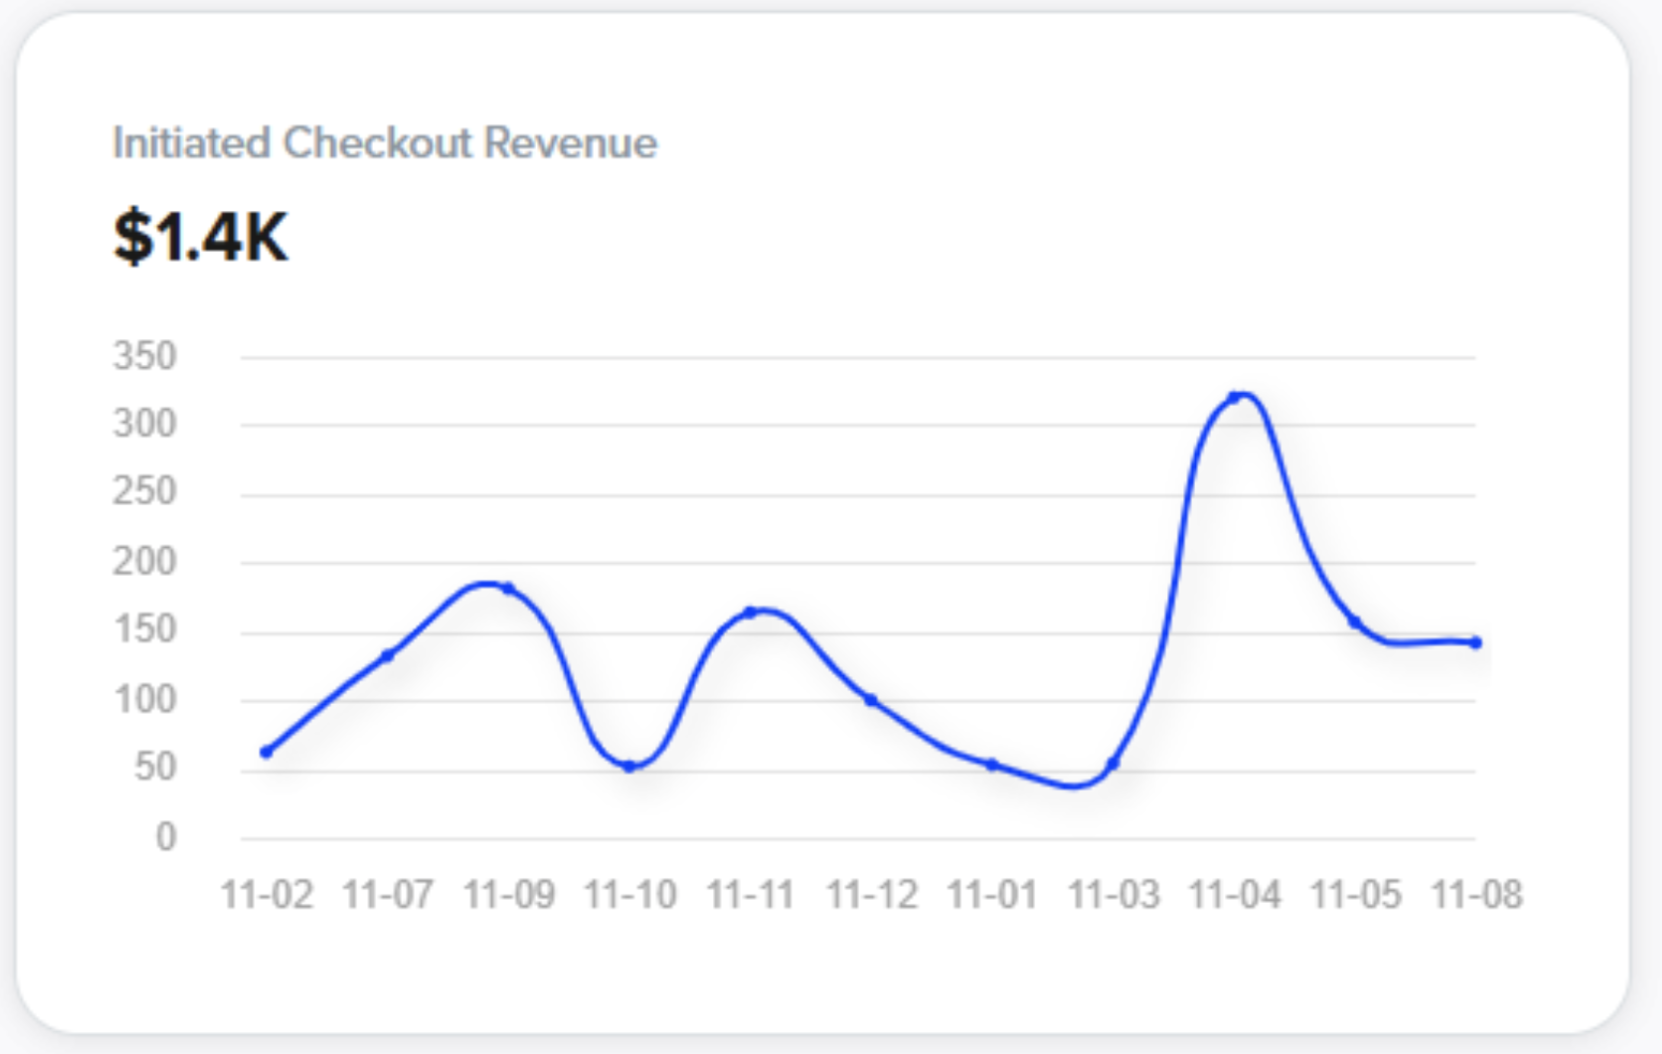
Initiated Checkout Revenue | This amount is how much is added to carts from the shoppable videos. | Shows full potential for revenue from the videos. | If this is dropping, maybe consider adding new videos or changing up content shown. |
 | |||
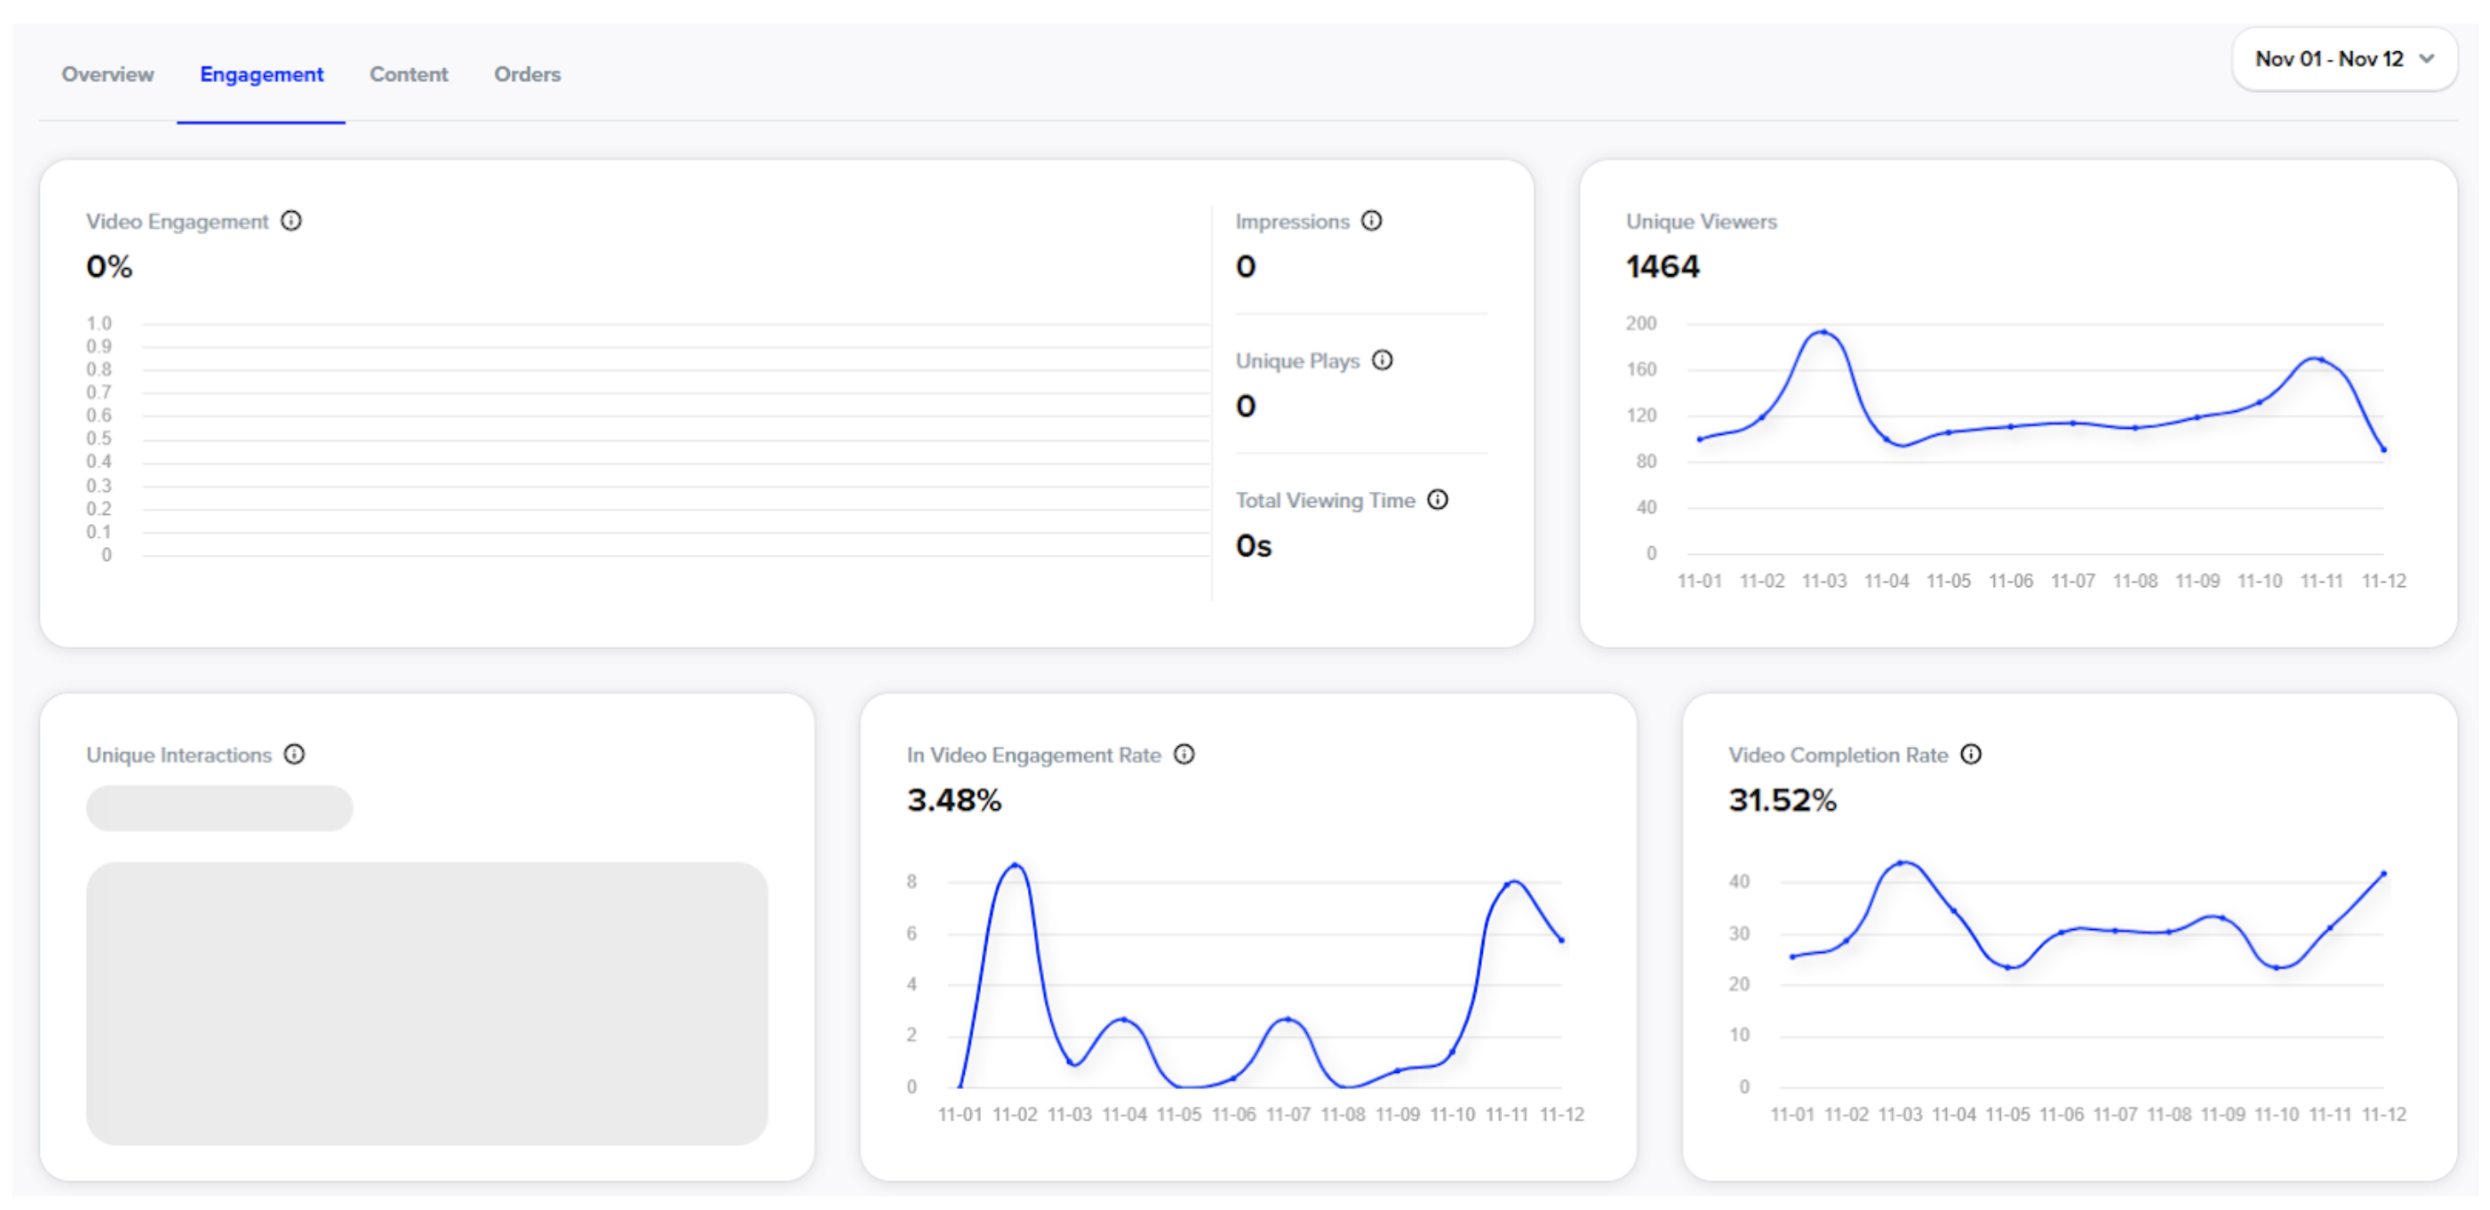
Engagement Tab: | Breakdowns of engagement how many individual people are interacting with the videos. It shows % of customers that interact once they click into a video (In Video Engagement Rate). | These segmentations help you understand how engaged your audience is. | If engagement drops, consider adding new videos, changing placement of videos, or changing the creators of the videos. Different creators will engage different customers. |
 | |||
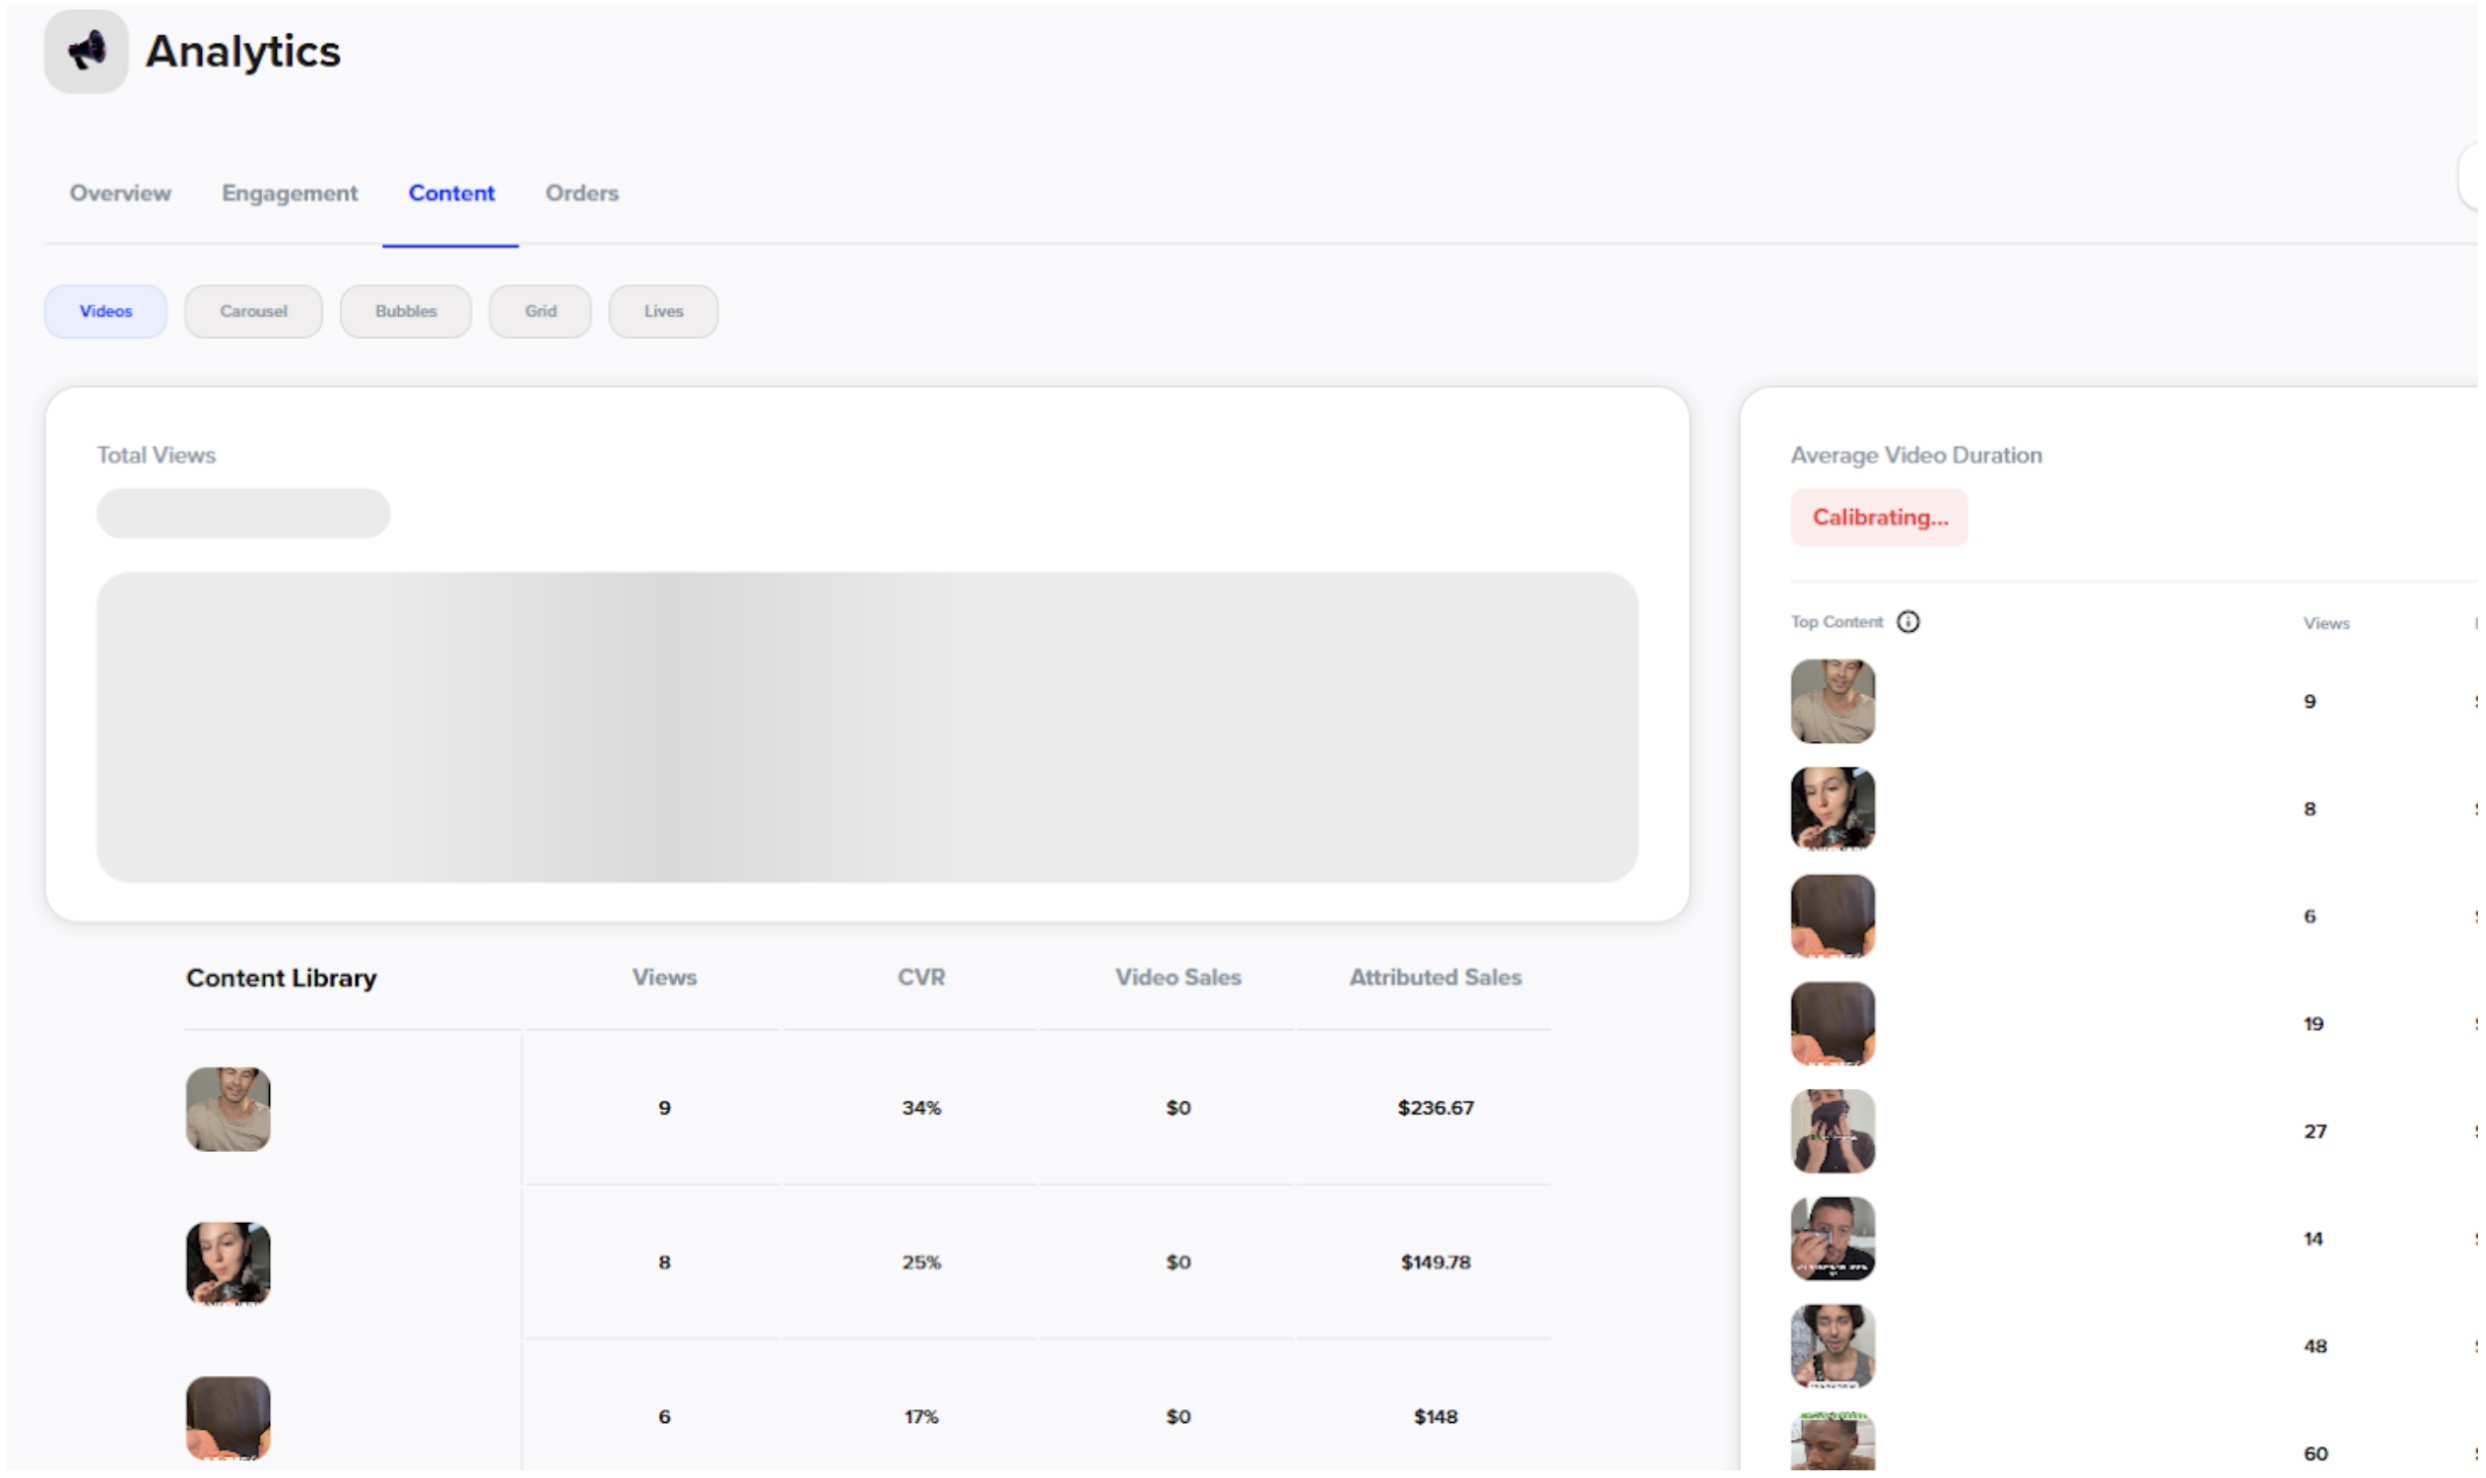
Content Tab: | This tab breaks down each video individually. | This helps you understand how each video is performing. | If you notice that one creator/style of video is out performing others, create more like that one. |
 | |||
Orders Tab: | This section shows exactly which orders were attributed to which type of sale. | Again, “Video Sale” is a customer adding to cart while watching a video and checking out. “Post Video” is a sale within the same website session. “Attributed” is within 7 days of that add to cart from the video. | Creating urgency in a video helps to produce more “Video Sales” which is ideal. |


4. How to Interpret the Data & Make Decisions
A. Identify High-Performing Content
Look for videos with high engagement time and strong click-throughs/conversions. These are your “stars”.
Review what these videos did well: length, hook, content type (demo vs testimonial vs UGC), placement, and calls-to-action.
Replicate the structure, style, and placement of these high-performers in future uploads.
B. Identify Underperformers & Diagnose
Videos with high views but low engagement suggest the hook or opening may be weak. Consider shorter intros, stronger visual interest, or better framing.
High engagement + low clicks: maybe the product tags or interactive elements aren’t compelling or obvious enough.
Low conversion despite clicks: investigate the post-click experience (product page relevance, inventory availability, checkout friction).
Segment drops: e.g., if mobile performs well but desktop doesn’t, you may need a different format or CTAs for desktop users.
C. Optimize Placement & Channels
Use the segment (device/channel) data to decide where to focus: e.g., if email-embedded videos outperform site embeds, prioritize email campaigns.
Consider A/B testing different placements (homepage vs product page vs checkout screen) and use the analytics to compare performance.
D. Set Benchmarks & Monitor Trends
Track metrics over time to identify trends (e.g., engagement improving, drops in conversion).
Set internal benchmarks (e.g., aim for click-through rate X%, conversion rate Y%) and monitor monthly.
Use the data to inform content planning cycles (e.g., types of videos to produce, when to push live streams, which products to feature).
6. Advanced Tips & Best Practices
Leverage Live Streams: Live shopping events often lead to increased engagement and excitement — monitor how your live content performs vs prerecorded.
Segment for Personalization: Use analytics to see which content resonates with which audience segments (e.g., repeat customers, first-time buyers) and personalize video feeds accordingly.
Optimize for Mobile: Since video engagement on mobile is often higher, ensure your video widget and shoppable elements are optimized for mobile viewing and fast loading.
Embed at Key Touchpoints: Placement matters — videos on product pages, homepage carousels, email embeds, and mobile app feeds each have different roles in the funnel.
Iterate Based on Data: Use the analytics insights to tweak your approach regularly: refine content types, CTA placement, video length, and product focus.
Connect with Your Tech Stack: Ensure your video analytics tie back into your overall ecommerce metrics (checkout data, average order value, churn, etc.). The more connected your data sources, the clearer your insights.
Have more questions? Reach out to our support team - we’re happy to help!
Happy selling! ✨